My experience tells me that if your web applications (or even the windows applications) run slower, 90 percent of the time, it's because some sql queries, stored procedures, indexes on the tables are not optimized. It's very important that you can find which query, which table are running slowly.
The book "SQL Server Query Performance Tuning Distilled" by Sajal Dam is a very good book on this topic.
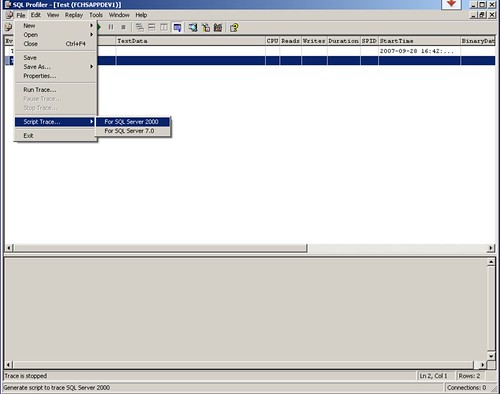
- Use the sql profiler to find what queries are taking long time, but I finds out it's not very pleasant to work with the user interface of the profiler. It's especially annoying even if you click on the stop button, the events are still being logged. (The stop command sent through the user interface is taking long time because the logging thread is very busy in logging the events in the sql server. This is a typical scenario when you try to kill a thread which is in a busy while loop.) The author provides an alternative way to do this, you can use the sql profiler to create a template or open an existing template, and stop the log immediately after starting the log (You only need do this once, so it won't be too painful). You don't have to do that, this step simply helps you to prepare the sql scripts. You can use sp_trace_create, sp_trace_setevent, sp_trace_setfilter to create all the scripts manually. In the profiler, you can script the trace definition and the step to run the trace to a SQL script file by selecting File->Script Trace -> For SQL Server 2000.

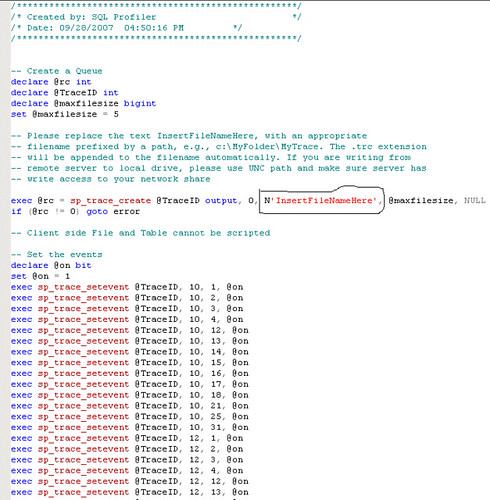
- Open the saved script file in Query Analyzer, and modify the InsertFileNameHere parameter of sp_trace_create to a meaningful filename.

- Execute the sql script, which will start the SQL trace as a background process. It also returns the ID of the trace as traceid, which is very important and required to stop the trace later on. You can use the SELECT * FROM ::fn_trace_getinfo(default) to find the trace status.
- Use EXEC sp_trace_setstatus traceid, 0 to stop the trace and EXEC sp_trace_setstatus 1,2 to close the trace.
- Open the trace log file in the profiler and save it to a table, and you can query the cpu time, logical read, or anything else you selected in the profiling process.
No comments:
Post a Comment